(選自PLoS ONE, May 2012)
LCT200具備內置的棕色脂肪測量的標準操作方法(protocol),檢測體內棕色脂肪的分布和定量體積,該技術已獲得歐洲及美國的ZL,比使用同位素的方法安全。
研究背景:現代的生活方式導致了肥胖的高發。由能量攝取和消耗不平衡所導致的肥胖通常會伴隨高血壓,血脂異常,冠心病等癥狀,最終導致新陳代謝異常。脂肪的分布而不是總脂肪量決定了新陳代謝的狀況。皮下脂肪對人體有益,而內臟脂肪的增加及肝臟、骨骼肌及胰腺的異常脂肪量則會增加2型糖尿病的風險。另一個與新陳代謝疾病密切相關的是廣泛存在的非酒精性脂肪肝疾病。最近,棕色脂肪(BAT)逐漸吸引了廣泛的關注。棕色脂肪的研究主要集中在小動物體內,然而新的數據表明BAT同樣在成人體內發揮作用,BAT的量與BMI值呈現負相關性,表明棕色脂肪在人體內能量代謝的作用。
目前檢測人體腹部脂肪和肝臟脂肪含量的金標準是MRI
and CT。小鼠的身體脂肪通常由定量核磁共振法quantitative magnetic resonance (QMR)
所測量,該技術測量精確,不需對動物麻醉且測量速度快,但是無法區分皮下脂肪和內臟脂肪,因此在本次實驗中,我們使用LaTheta
LCT-200來區分腹部脂肪及皮下脂肪并對兩部分脂肪進行定量研究,同時我們也用該儀器測量了肝臟脂肪含量及棕色脂肪情況。
棕色脂肪是負責分解引發肥胖的白色脂肪人體組織,將其轉化成二氧化碳、水和熱量。它可以加快人體新陳代謝,促進白色脂肪消耗。鑒于棕色脂肪在代謝中的獨特表現,近年來已經成為人們研究的熱點。在具體的實驗操作中,同樣也面臨如何測量棕色脂肪的問題。Latheta LCT200獨有的歐洲和美國ZL,使得其具有測量棕色脂肪的能力,這也是全球唯一一款可以測量棕色脂肪的micro-CT。
LCT-200具備內置的棕色脂肪測量的標準操作方法(protocol),檢測體內棕色脂肪的分布和定量體積,該技術已獲得歐洲及美國的ZL,比使用同位素的方法安全。
方法:我們使用不同的消瘦及肥胖小鼠模型 (C57BL/6, B6.V-Lepob, NZO) 來確定掃描不同部位脂肪的最佳的掃描參數。數據與掃描后的實際稱重相比較。肝臟脂肪量由生化分析法測定。
結果:脂肪組織經天平稱重的值與經CT測量值的相關性為:皮下脂肪
(r2 = 0.995), 內臟脂肪(r2 = 0.990),總的白色脂肪(r2 = 0.992).
另外,利用腹部區域(腰椎L4到L5之間)的掃描與身體脂肪的相關性可以減少掃描時間,并降低對實驗動物的輻射及麻醉。
CT掃描所得的肝臟脂肪量與生化分析的結果呈線性相關(r2
= 0.915)。另外,棕色脂肪的CT測量結果與天平測量的結果呈高度相關 (r2 = 0.952)。短期冷凍 (4℃, 4 hours)
導致棕色脂肪含量變化,從而引起甘油三脂變少,這種變化可由CT成像時CT值的增加體現。
結論:LCT200對小鼠總脂肪,皮下脂肪、內臟脂肪及棕色脂肪、肝臟脂肪的3D成像及定量分析可靠準確,這種非入侵的方式可以使我們對小鼠的肥胖情況進行長期的掃描研究。
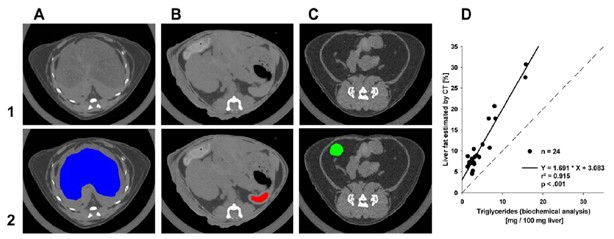
Figure1. Quantification of hepatic fat by CT. Selected areas of liver (A; blue), spleen (B; red) and WAT (C; green) for determination of mean HU values. upper panel (1): raw gray scale scan slices, lower panel (2): selected organ parts used in calculation of liver fat. (D) Relationship between amounts of intrahepatic fat isolated and quantified with biochemical analysis and estimations by computed tomography. Dashed line – identity line,r2 - coefficient of determination.
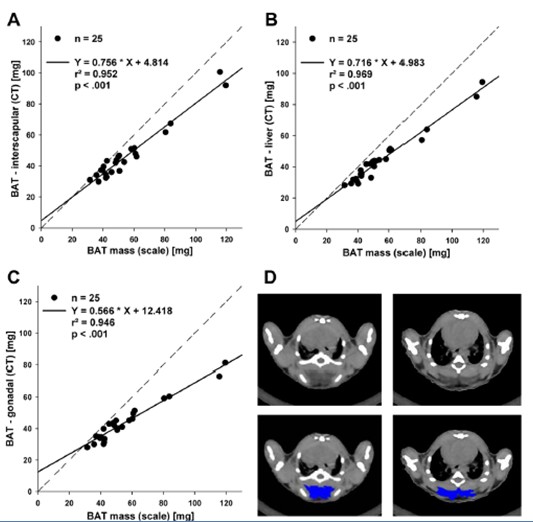
Figure 2. Brown adipose tissue. Correlation between resected brown adipose tissue (BAT) weighted on scale and estimations of fat depotweights by CT. (A) BAT depot in situ (interscapular), (B) resected BAT depot inserted under the liver, (C) resected BAT depot inserted in gonadal fatdepot; dashed line – identity line, r2 - coefficient of determination. (D) Analysis examples of two different slices of interscapular brown adipose tissuedepot by ImageJ (NIH) program. Upper panel: raw gray scale scan slices, lower panel: manually outlined and selected BAT in ImageJ (NIH).